

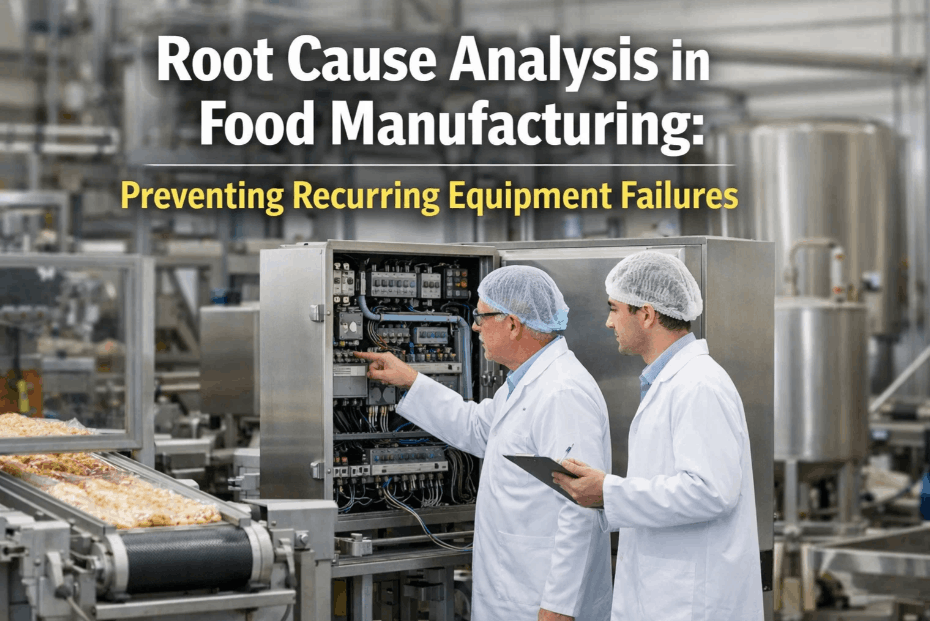
One single bad lot can negate all the efforts done to develop the brand over many years. With the release of a food product with undeclared allergens, pathogens or foreign materials, there are consequences that emerge fast consumers get injured, products are withdrawn from the shelves, the authorities begin to investigate and the firm loses money that can amount to several times more than the value of the damaged product itself. What most firms do in response is fix the problem and go on, only for the same failure to reoccur after some months. The prevention of the issue is possible only if the reasons behind it are found out and that is what the investigation process does.
Why Are Foods Recalled?
Recalls usually don’t happen due to one critical error made. Usually, they represent the culmination of a string of little mistakes that occur in the right order to lead to food safety problems. The cleaning protocol gets shortened during a hectic shift, a new supplier changes the recipe of the product without notification, an old label design is used for printing labels, or the metal detector stops working. Individually, each of these issues may not look serious enough to cause a hazard, but all together they provide the opportunity.
The consequences of failing here are significant. Direct costs include product retrieval, disposal, replacement, and logistics. The indirect costs may actually be greater: lost contracts, ruined relations with the retailer, potential lawsuits, and consumer trust recovery taking many months or even years. In the case of a small manufacturer, a serious product recall may become a reason for its closure. The understanding that most recalls have systemic nature represents the starting point for prevention.
Root Cause Analysis using a Fishbone Diagram: Mapping the Problem
Root Cause Analysis is an organized process of investigating a failure through a systematic backward search of the underlying conditions that created the possibility of the failure. Its basic principle is straightforward but strict: addressing the symptoms will not eliminate the problem. If a piece of metal is found in a product and the only reaction to it is just discarding the product lot and retraining one operator, then the true reason may be a worn part or a lack of inspection step.
One of the most useful diagrams for doing so is the Fishbone Diagram, which is also called the Ishikawa diagram. The problem statement appears at the top of the fish while the primary bones are categories of potential causes of the problem. As far as food manufacturing goes, the traditional categories include people, methods, machines, materials, measurements, and the environment. Some teams tend to consider a seventh category, which relates to management systems, since most of the problems in manufacturing come down to the management’s decision about staffing, scheduling, or allocation of resources.
This approach is quite useful as it compels a group to take a broader view before offering the final hypothesis. Most of the investigations are flawed by the fact that people try to find the first potential cause of the problem, which is typically an individual’s fault. In a Fishbone Diagram, the team is compelled to ask whether the training program was adequate, whether the procedure was described correctly, whether the equipment was serviced properly, whether the raw material corresponded to the standards, and whether the measurement method allowed detecting the problem.
Using the Fishbone Diagram for Root Cause Analysis on the Production Line
The effectiveness of any Fishbone Diagram depends greatly on the process that supports it. The best way to conduct a Root Cause Analysis involves bringing a cross-functional team of quality assurance experts, production specialists, maintenance specialists, sanitation experts, procurement specialists, and someone from the production line itself. The operators know why procedures are not necessarily adhered to in reality, and without them, one might miss the most interesting information.
The problem statement should be clear and factual, and placed at the beginning of the diagram. Then, the team goes through all categories such as materials, methods, machines, measurements, people, and environment. Within each category, it asks itself whether the requirements were met, whether the procedure was realistic, whether the equipment could be easily and effectively cleaned and maintained, whether the testing was sufficient, whether the training was good enough, and whether the floor conditions supported safe production.
The task is to determine which ones really contribute to the problem and which are just guesses. The five whys analysis helps find out which factors need to be changed. But the factor identified by this process is usually not an irresponsible person. This realization does not pertain to an irresponsible individual. Rather, it pertains to flaws within the process, such as unreasonable deadlines or lack of checks and balances, which should be corrected.
Putting Findings to Work in Corrective and Preventive Actions
The investigation would only be useful if it results in change at the factory. After the causes have been validated, the next step is to come up with actions that correct these issues. Distinguishing between corrective actions, which address the actual problem, and preventive actions, which avoid another problem of a similar nature from happening in other areas of the process, can be helpful. An example of the former could be a redesigned changeover procedure for the bakery and the cleaning validation, while an example of the latter could be a review of all product changeovers at the factory for similar schedule conflicts.
Effective actions are concrete, assigned ownership and time-specific. The actions, which involve increased awareness or reminder, are usually not very effective since they rely heavily on memory and good intentions rather than on systems. More substantial actions change working conditions by altering design of equipment in order to make it easier to clean, introducing a validation step before restarting production, changing schedules or suppliers’ specs/audits.
Verification completes the loop. Once the action is taken, the team needs to verify that it works by conducting further testing, observing, and analyzing the data within the given time frame. Many companies bypass this stage and later find out that the solution only exists on paper. Feedback should also be provided to other aspects of the food safety program, which includes hazard analysis and critical control points to improve the entire program.
Creating the Right Culture to Prevent the Recalls
Templates and tools alone do not prevent recalls. The key thing is how an organization deals with problems: whether it sees them as a chance to learn something or an opportunity to place blame. When there is a fear of blame, people will avoid reporting near-misses. Near misses are those indicators which provide a chance for preventive measures to be implemented. If a factory provides an opportunity to report small deviations from the process such as a loosened seal or a rushed cleaning, it will have a chance to investigate the problem.
Leadership definitely makes the difference here. Training investments, maintenance of the equipment, and allowing realistic manufacturing schedules also convey that food safety is highly valued next to production goals. Analyzing complaints, conducting internal audits and tracking deviations can show repeating trends far before any official recall becomes needed, and sharing this information across the shifts and departments ensures broad learning experience.
Working with the suppliers also fits into the culture. In fact, many risks get into the facility in the form of materials, and therefore successful risk management should go up along the chain in the form of approving suppliers, controlling the specifications, and performing incoming inspections. Treating the suppliers as safety partners, explaining changes clearly, and investigating the issues together will close this blind spot.
Conclusion
A food product recall is always expensive and disruptive. Yet, it is not an accident but a result of some process, equipment, communication or decision making deficiencies identified by proper analysis. Root Cause Analysis provides manufacturers with a methodology to see what lies behind the symptoms while the Fishbone Diagram technique encourages a team to examine all the angles of a particular problem rather than its most obvious cause. Food product manufacturers must remember that the best defense is to know the root cause of each failure and never let it happen again.